=If([Flight Date] < Date('2024-02-10'),
    // 2023 农历年(假设起点 2023-01-22,最后一周编号 46)
    //'2023/LW' &
    Num(Floor(([Flight Date] - Date('2023-01-22')) / 7) + 1, '00'),

If([Flight Date] < Date('2025-01-29'),
    // 2024 农历年(起点 2024-02-10,上一年最后一周编号 46)
    //'2024/LW' &
    Num(Floor(([Flight Date] - Date('2024-02-10')) / 7) + 1, '00'),

If([Flight Date] < Date('2026-02-17'),
    // 2025 农历年(起点 2025-01-29,上一年最后一周编号 46 + 计算偏移)
    //'2025/LW' &
    Num(Floor(([Flight Date] - Date('2025-01-29')) / 7) + 1, '00'),

    // 2026 农历年(起点 2026-02-17)
    //'2026/LW' &
    Num(Floor(([Flight Date] - Date('2026-02-17')) / 7) + 1, '00'))))
分类: 工作
-

Qlik Sense Luna Week Num 设置
-
Qlik Sense 中如何选择今年的时间,measure 显示去年的数字
比如这里我在
[trip_flight_date.autoCalendar.YearMonth]
中选择2025-Oct, 2025-Nov。 我却要在Measure 中直接显示2024-Oct, 2024-Nov 的数字。
Sum(
{< [trip_flight_date.autoCalendar.YearMonth] = {$(= Concat( DISTINCT chr(39)&Date( AddMonths( Date#([trip_flight_date.autoCalendar.YearMonth],'YYYY-MMM'), -12 ), 'YYYY-MMM' )&chr(39), ',' ) )} >}
od_pax
)最主要的是以下这段。
Concat(
DISTINCT
chr(39)&Date(
AddMonths(
Date#([trip_flight_date.autoCalendar.YearMonth],’YYYY-MMM’),
-12
),
‘YYYY-MMM’
)&chr(39),
‘,’
) -
Qlik Sense 中如何在button or sheet action 中选中多个选项。
- Toggle field selection
- ='(A|B|C|D)’
- Select values matching search criteria
- =’=Sum([Sales Amount]) > 200000′.
- Select values in a field
- =’A;B;C;D’
- Toggle field selection
-
Qlik Sense 中在饼图中既显示数字又显示百分比
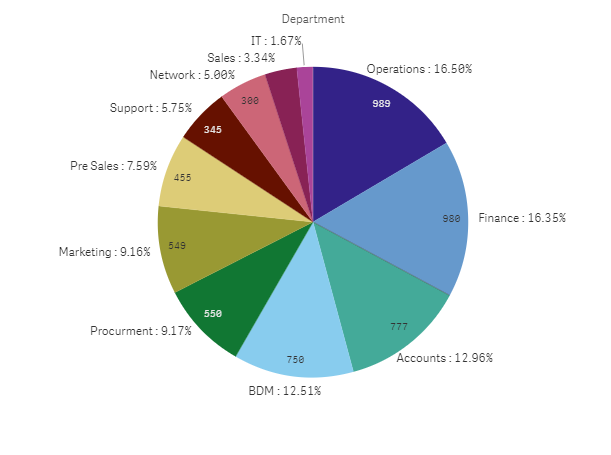
效果如上图,可以如下设置
Dimension:
=YourDim&' : '& aggr(num(sum(YourMeasure)/sum(total{<YourDim>} YourMeasure),'#,##0.00%'),YourDim)Measure:
sum(YourMeasure)